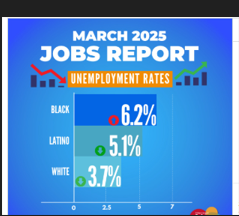
The U.S. unemployment rate increased by 0.1 percentage points from the previous month to 4.2% in recent days. That figure alone could make some people wonder. However, beneath the surface, the March jobs report shows a labor market that is remarkably strong and resilient. Similar to observing a heartbeat while jogging, minor variations may appear problematic—until you realize they are a sign of a more robust rhythm developing.
With 228,000 new jobs added in March, job growth exceeded Morningstar’s prediction of 125,000 by a significant margin. These figures, which were taken from the dual surveys conducted by the Bureau of Labor Statistics, show rising demand in the transportation, healthcare, and social assistance sectors—all of which are exceptionally good at taking in returning workers and are especially resilient to economic shocks.
Jobs Report March 2025 – Key Labor Market Indicators
| Metric | March 2025 | Change Since Feb 2025 |
|---|---|---|
| Unemployment Rate | 4.2% | +0.1 percentage point |
| Nonfarm Payroll Employment | +228,000 | Above 125K forecast |
| Labor Force Participation | 62.5% | +0.1 percentage point |
| Employment–Population Ratio | 59.9% | No change |
| Total Unemployed Individuals | 7.08 million | +31,000 |
| U-6 (Broad Unemployment Rate) | 7.9% | -0.1 percentage point |
| Weekly Jobless Claims (Ending April 12) | 215,000 | -9,000 |
| Retail Employment | Increased | Reflects return from strike |
| Federal Government Employment | -4,000 | Continued decline from February |
| Four-Week Moving Average (Initial Claims) | 220,750 | -2,500 |
Realism Encased in Optimism
The report’s most notable finding is that, in spite of robust hiring, the unemployment rate increased. This may seem counterintuitive, but it is actually especially advantageous for long-term recovery. Discouraged workers are increasing participation metrics by returning to the workforce. A rising rate can occasionally be an indication that hope is returning.
The increase in participation indicates a renewed sense of optimism among job seekers in the context of economic recovery. Many people are now resuming their search after pausing it because of health issues or market uncertainty. This re-engagement indicates a return to regular rhythms, even if there is momentary congestion, much like commuters returning to rush-hour traffic after months of working remotely.
Government Employment Declines, Private Sector Growth Continues
March saw a further 4,000 decline in federal government employment, which is linked to recent efficiency initiatives carried out by the Department of Government Efficiency (DOGE). But not all departures are immediately reflected because of severance policies and technical classifications, so March’s number might only be a small portion of broader restructuring initiatives.
On the other hand, industries like healthcare and retail have established themselves as major employers. Their expansion, partly due to restructuring brought on by the pandemic, has made them incredibly dependable job creators. The return of previously striking workers was especially beneficial to retail, highlighting the delicate balance between labor activism and economic recovery.
Assessing Momentum Rather Than Just Data
Weekly unemployment claims fell by 9,000 to 215,000, serving as a stark reminder that, despite reports of government cuts and tech restructuring, layoffs are not increasing. For analysts keeping an eye on the market’s short-term pulse, the four-week moving average, a more stable indicator of labor stability, also saw a slight decline.
Economists are developing a more sophisticated understanding of the recovery’s trajectory by utilizing a variety of indicators, not just the headline unemployment rate. This multi-metric approach is proving to be remarkably effective in navigating economic uncertainty, much like reading a map and a compass.
The 4.2% Opportunity
The current 4.2% unemployment rate is more of a strategic checkpoint than a warning indicator for businesses and policymakers. Employers are rehiring, workers are returning, and industries are readjusting, all of which reflect a labor force in motion. Flexibility turns into money in this situation, and those who can adjust quickly will come out stronger.
We’ve seen over the last ten years how general metrics can obscure specific realities. The U-6 unemployment rate, which accounts for part-timers and workers with marginal attachments, subtly dropped to 7.9%, suggesting that the quality of employment—rather than just the quantity—is gradually improving. The picture painted by that detail, which is frequently hidden in footnotes, is far more positive than headlines imply.
Progressing the Storyline
The way we analyze employment data will change over the next few years. It has to. Our economy is no longer characterized only by office jobs and industrial output. Digital platforms, AI-enhanced hiring, gig work, and remote freelancing are all changing our perception of what a “job” actually is.
Businesses are developing hiring systems that are surprisingly inclusive and incredibly efficient by combining workforce analytics and predictive modeling. AI-driven technologies that identify skills beyond resumes are now surfacing previously unnoticed job seekers. This trend is especially novel and has the potential to change long-term unemployment measures in ways that conventional forecasting was unable to predict.


