


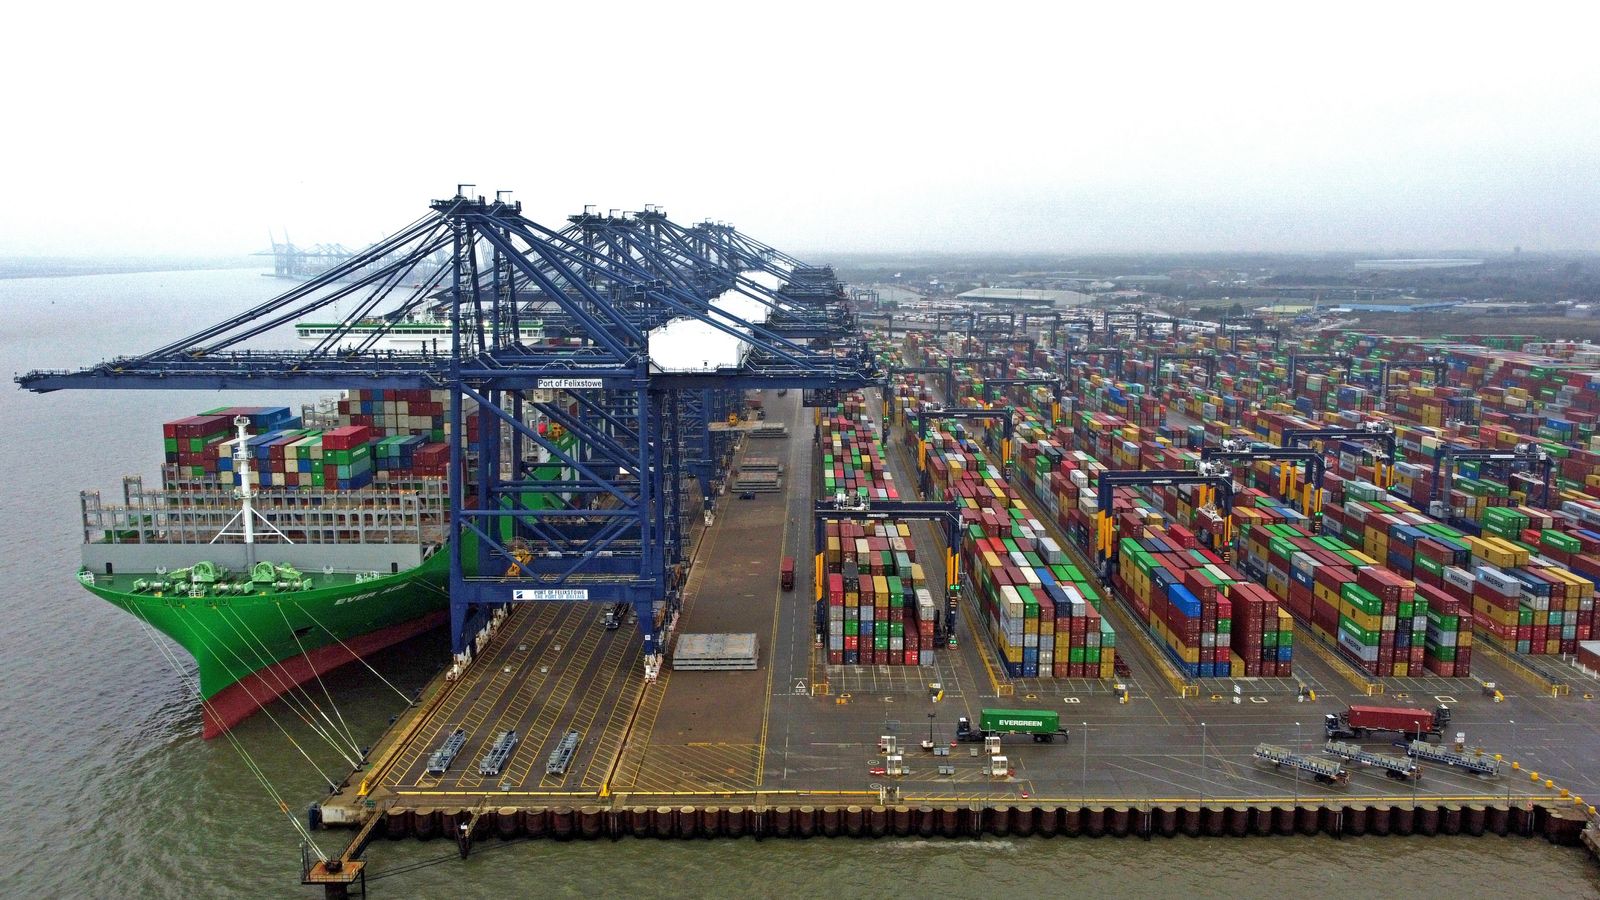
The European Union remains the United Kingdom’s largest single trading partner, accounting for roughly half of all UK foreign trade. However, the structural realities of post-Brexit commerce, combined with full border controls under the UK’s Border Target Operating Model (BTOM) and evolving rules under the Trade and Cooperation Agreement (TCA), continue to reshape cross-border supply chains.
This statistical report provides a comprehensive examination of UK–EU bilateral trade in goods and services for 2026, drawing on official data from the Office for National Statistics (ONS), HM Revenue & Customs (HMRC), the Department for Business and Trade (DBT), and Eurostat.
Official 2026 trade figures show that the European Union remains the UK’s primary economic partner, representing approximately 41% of UK exports and 52% of UK imports. While physical goods trade continues to face administrative friction from full border controls, UK commercial and professional service exports to the EU have shown resilience, offsetting deficits in manufactured goods and agricultural products.
Overall UK–EU Trade Balance in 2026
Bilateral trade between the UK and the EU is characterised by a structural asymmetry: the UK maintains a substantial deficit in physical goods trade, partially offset by a persistent surplus in services.
| Trade Stream | Annual Value (£ Billion) | Share of Total UK Trade (%) | Year-on-Year Trend |
| UK Goods Exports to EU | £182.4 | 41.2% | -1.1% |
| UK Goods Imports from EU | £310.8 | 52.4% | +0.8% |
| Goods Trade Balance | -£128.4 | — | Deficit widened |
| UK Services Exports to EU | £174.5 | 37.8% | +4.2% |
| UK Services Imports from EU | £121.2 | 34.1% | +2.1% |
| Services Trade Balance | +£53.3 | — | Surplus expanded |
| Total Bilateral Trade | £788.9 | 45.1% | +1.3% |
Source: Compiled from Office for National Statistics (ONS) UK Trade Balance releases and HMRC Overseas Trade Statistics.
Key Facts
-
Total Trade Volume: Total bilateral trade in goods and services between the UK and EU reached approximately £788.9 billion on an annualized basis.
-
Goods Deficit: The UK’s trade deficit in goods with the EU stands at £128.4 billion, driven largely by imports of road vehicles, machinery, and processed food products.
-
Services Surplus: The UK recorded a £53.3 billion surplus in services trade with the EU, led by financial, business, and professional services.
-
Top Export Destination: Germany remains the single largest national market for UK exports within the EU, followed by the Netherlands, France, and Ireland.
-
Border Controls: Full implementation of safety, security, and sanitary/phytosanitary (SPS) declarations under the Border Target Operating Model (BTOM) has established a permanent administrative baseline for agri-food imports.
Breakdown of Trade in Goods
Physical trade in goods has absorbed the highest proportion of post-Brexit regulatory friction. Customs declarations, Rules of Origin compliance, safety and security requirements, and SPS checks have elevated compliance costs for small and medium-sized enterprise (SME) exporters.
Primary UK Goods Exports to the EU
-
Mineral Fuels and Oils: Refined petroleum products and natural gas re-exports remain a significant capital component of trade with continental hubs.
-
Machinery and Mechanical Appliances: High-value industrial components, power generation equipment, and specialized manufacturing machinery.
-
Automotive Vehicles and Parts: Interconnected supply chains in motor vehicle manufacturing, subject to EV battery rules-of-origin thresholds.
-
Pharmaceutical and Chemical Products: High-value active pharmaceutical ingredients and specialty chemicals subject to REACH compliance regimes.
Primary UK Goods Imports from the EU
-
Road Vehicles: Passenger cars, commercial vans, and heavy goods transport equipment from Germany, Spain, and France.
-
Electrical Machinery: Precision electronics, consumer hardware, and industrial power equipment.
-
Agri-Food & Beverages: Dairy, meat products, wine, and processed foodstuffs entering under full BTOM health certification requirements.
-
Medicinal and Pharmaceutical Products: Finished pharmaceuticals and therapeutic supplies.
Breakdown of Trade in Services
Unlike physical goods, UK services trade with the EU has demonstrated unexpected structural expansion. Despite the loss of single-market passporting rights in financial services, UK firms have adapted through European subsidiaries and remote service provision.
Sector Performance in Services Trade
-
Financial and Insurance Services: While institutional capital shifted towards Frankfurt, Paris, and Amsterdam following Brexit, London maintains a dominant global position in wholesale banking, clearing, and risk management.
-
Professional and Business Services: Legal, management consultancy, accounting, and engineering services recorded a 4.2% annual growth in exports to EU clients.
-
Digital and Information Services: Software architecture, cloud infrastructure, and cybersecurity services continue to expand without border physical bottlenecks.
UK Impact
For UK businesses, trading with the EU in 2026 is defined by predictable regulatory compliance rather than transition volatility. However, small businesses continue to report higher administrative burdens relative to turnover:
-
SME Export Costs: Fixed costs associated with customs clearance, Export Health Certificates (EHCs), and regulatory representation have led some smaller UK firms to withdraw from direct EU consumer shipping, preferring European fulfillment hubs.
-
Supply Chain Realignment: Large UK manufacturers have embedded “just-in-case” inventory strategies, increasing warehouse storage capacity within both Great Britain and continental Europe to buffer against potential logistics delays.
EU Impact
For EU member states, the UK remains a critical export destination, particularly for agricultural goods and automotive manufacturing:
-
Agri-Food Exporters: Exporters in Ireland, the Netherlands, Denmark, and France have adjusted to UK border inspections, incorporating BTOM certification costs into pricing models.
-
Industrial Interdependence: Major European automotive and aerospace producers maintain complex multi-country component flows across the English Channel, relying on streamlined customs procedures where applicable.
Ireland Angle
Trade between Great Britain, Northern Ireland, and the Republic of Ireland occupies a unique position within the broader UK–EU framework:
-
Windsor Framework: The implementation of the Windsor Framework continues to govern trade between Great Britain and Northern Ireland, maintaining Northern Ireland’s position within the UK internal market while preserving access to the EU single market for goods.
-
North-South and East-West Flows: Trade between the Republic of Ireland and Northern Ireland has remained elevated, while direct maritime freight routes connecting Irish ports (such as Rosslare and Dublin) directly to continental Europe (Cherbourg, Rotterdam) remain established bypasses of the Great Britain landbridge.
Key Takeaways
-
Bilateral UK–EU trade stands at £788.9 billion, demonstrating the enduring economic integration between the two markets.
-
The UK maintains a £128.4 billion goods deficit with the EU, counterbalanced by a £53.3 billion services surplus.
-
Services represent the fastest-growing segment of UK exports to the EU, led by digital, professional, and corporate advisory sectors.
-
Border Target Operating Model (BTOM) procedures represent a permanent feature of UK port operations for EU goods imports.
-
Large businesses have adapted to post-Brexit rules via structural supply chain changes, whereas SMEs continue to face proportional cost challenges.
-
The upcoming formal review of the UK–EU Trade and Cooperation Agreement (TCA) remains the primary focal point for potential future regulatory adjustments.
Conclusion
The 2026 statistical picture shows a mature, stabilized post-Brexit UK–EU trading relationship. While the initial disruptions of regulatory divergence have given way to operational routines, the underlying composition of trade has shifted. The UK’s strength in high-value services exports continues to mitigate structural deficits in physical goods, highlighting the evolving nature of cross-border commerce across the English Channel.
FAQ
What is the total value of UK–EU trade in 2026?
Total annual bilateral trade in goods and services between the UK and the European Union stands at approximately £788.9 billion, based on Office for National Statistics (ONS) data.
Does the UK run a trade surplus or deficit with the EU?
The UK runs an overall trade deficit with the EU. While the UK maintains a £53.3 billion surplus in services trade, this is offset by a £128.4 billion deficit in physical goods trade.
What are the UK’s main goods exports to the EU?
The primary UK goods exports to the EU include mineral fuels, mechanical machinery, road vehicles and automotive components, chemical products, and pharmaceuticals.
How has the Border Target Operating Model (BTOM) affected UK imports?
The BTOM established permanent safety, security, and sanitary/phytosanitary (SPS) controls on goods entering Great Britain from the EU, formalizing customs declarations and physical checks for higher-risk products.
How are UK services performing in the EU market?
UK services exports have performed strongly, recording steady growth driven by legal, management consulting, accounting, engineering, and technology-related service sectors.
Which EU countries are the UK’s largest trading partners?
Germany is the UK’s single largest trading partner within the EU, followed by the Netherlands, France, Ireland, and Belgium.
How does Northern Ireland trade work under current rules?
Under the Windsor Framework, Northern Ireland maintains access to the UK internal market while continuing to participate in the EU single market for physical goods.
What proportion of total UK trade is with the EU?
The EU accounts for approximately 41% of total UK exports and 52% of total UK imports across goods and services combined.
